RETIT Performance Analysis SuiteProduct Documentation
Contents:
| • About |
| • Import |
| • Analysis |
| • Comparison |
| • Data Sources |
| • Granting Datascope Access |
About
This documentation describes the basic principles of working with RETIT Performance Analytics Suite. You can see the description of the main functions below:
- Import: Upload your loadtest result files to a centralised storage location
- Analysis: Get an overview of your loadtest results to find out your slowest transaction and get detailed information for individual transactions like response time distribution over time
- Comparison: Compare the results of different load tests that were executed with different software versions or workload configuration
These categories also reflect the sequence of actions that the user needs to perform in order to obtain the results of the analysis. Please note that some of the features listed below may only be available for certain file types. For more information see the Data Sources section.
Import
First of all, you need to upload the file to our system. To do this, select the Data Source in the user dashboard.
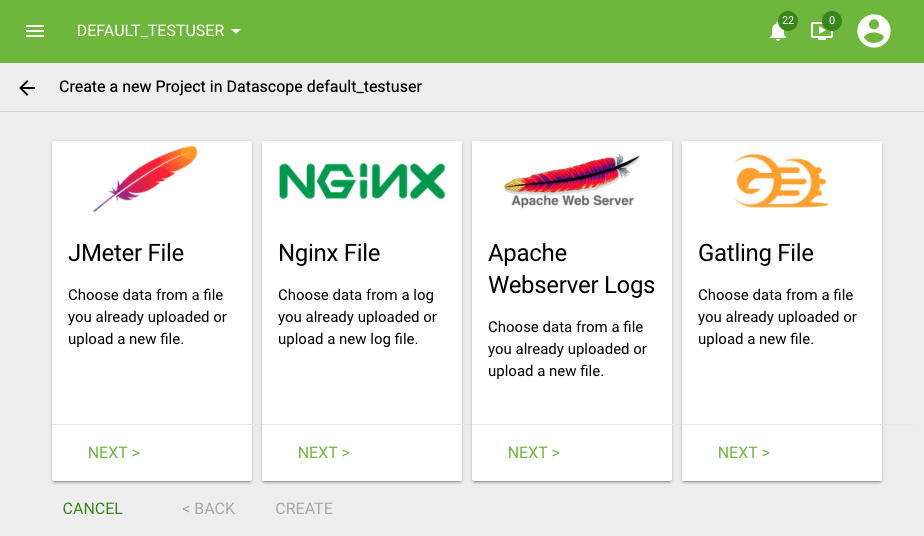
After selecting the file type, you will be redirected to a page, where you can upload your file. Depending on the selected type, you will be offered further upload steps. For more information see the Data Sources section.

Now you can click on the generated project and jump to the Analysis page.
Analysis
The analysis page provides an overview of the project you just generated. By default it shows all transactions that have been monitored and the corresponding data that have been measured for those transactions.
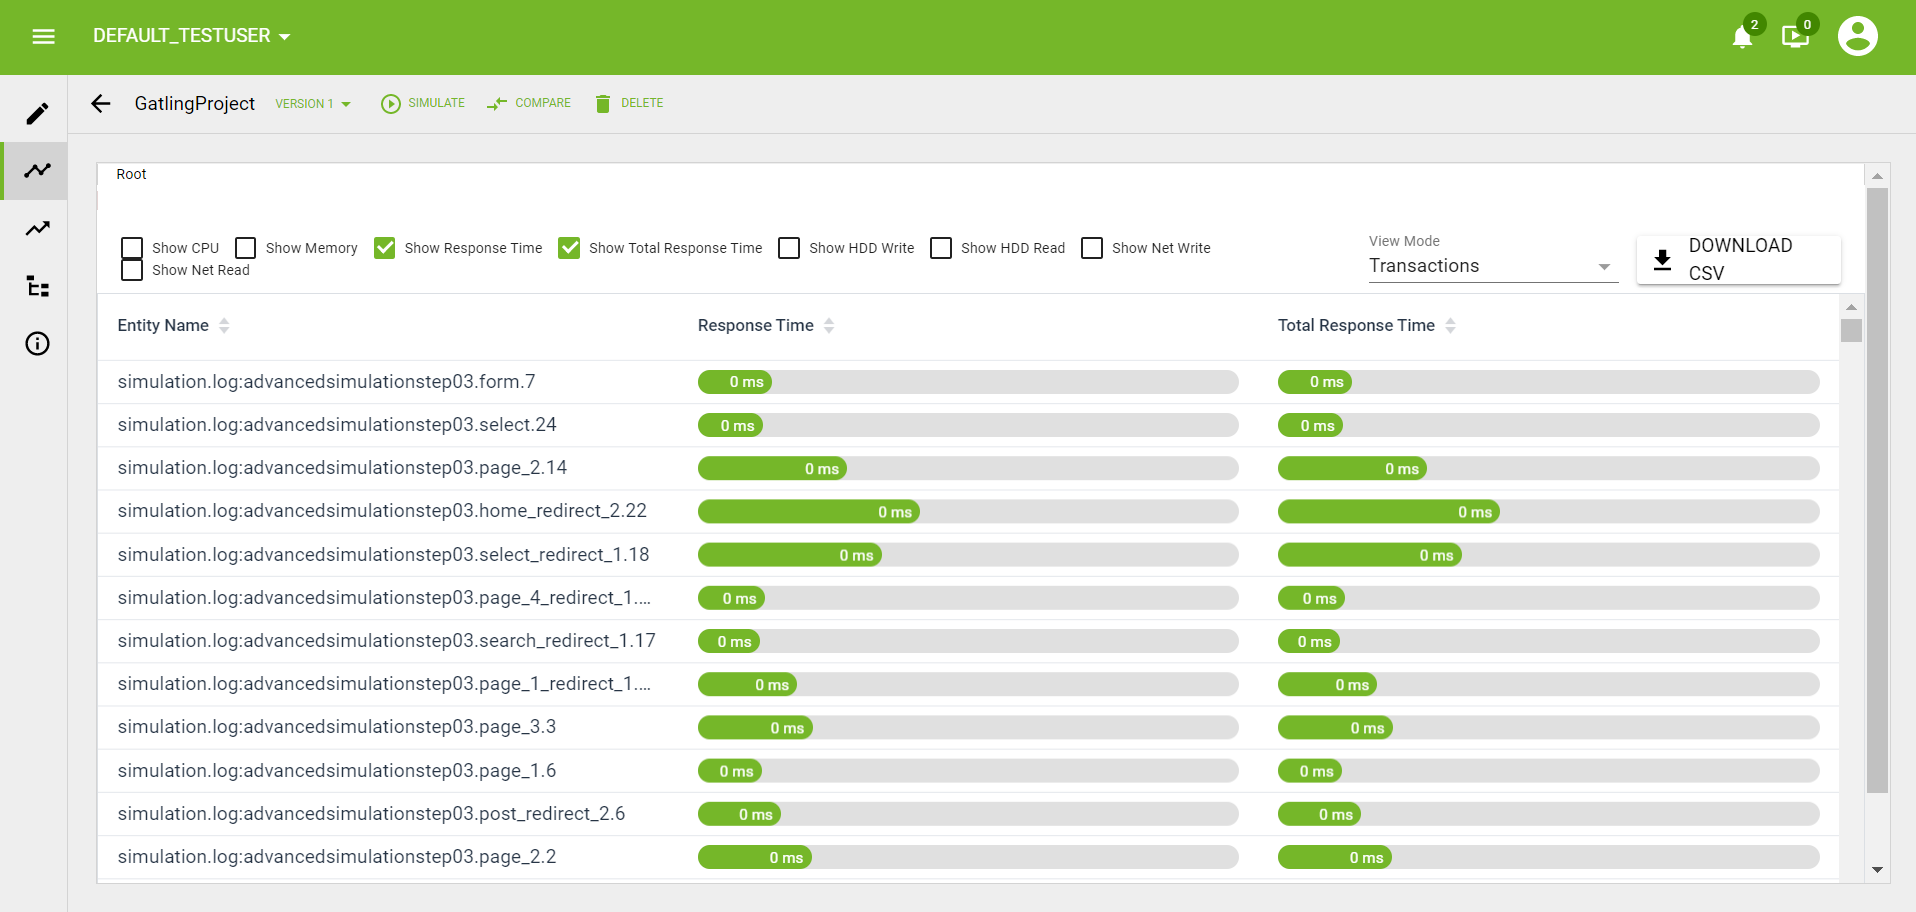
Here you can select the types of information to be displayed. The following types are available to choose from:
- Show Response Time
- Show Total Response Time
Depending on the data that your upload file contains, different types of information from the list above will be available for viewing.
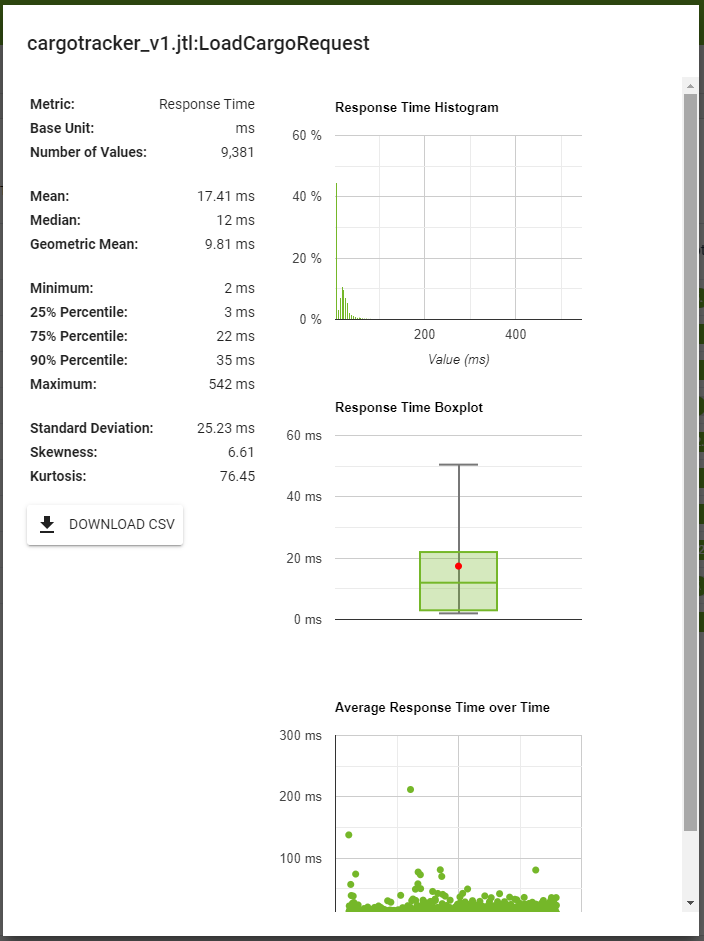
You can get more detailed information regarding a single transaction by clicking on the corresponding bar. This includes statistical values, a histogram, a boxplot and a distribution of the measured values over time.
If you click on the info button to the left of the comparison view, you can also obtain some basic information regarding your project.

In the next step you can compare the analysis data between different projects.
Comparison
After you uploaded a file in the previous steps and got the results of the analysis, you can compare it with the analysis results of another file. To do this, click the "Compare" button at the top and select the second file for comparison. After clicking the "Next" button you will see the results of comparing the analysis of the two files.
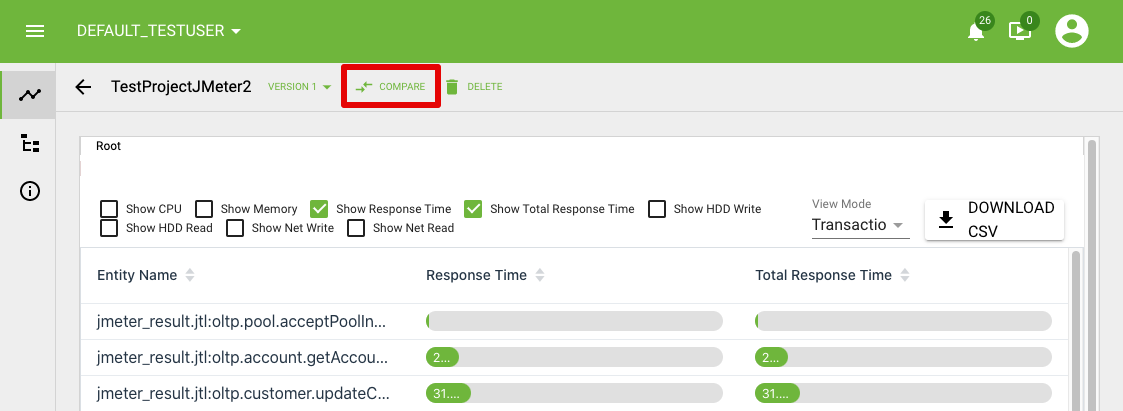
After that you can select Source and Target project in the appeared pop-up and click "Compare". You will be automatically redirected to the next page, where you can see a detailed comparison of the two analysis results. The page will be divided into two subsections: Transaction Metrics and Ressouce Container Metrics.
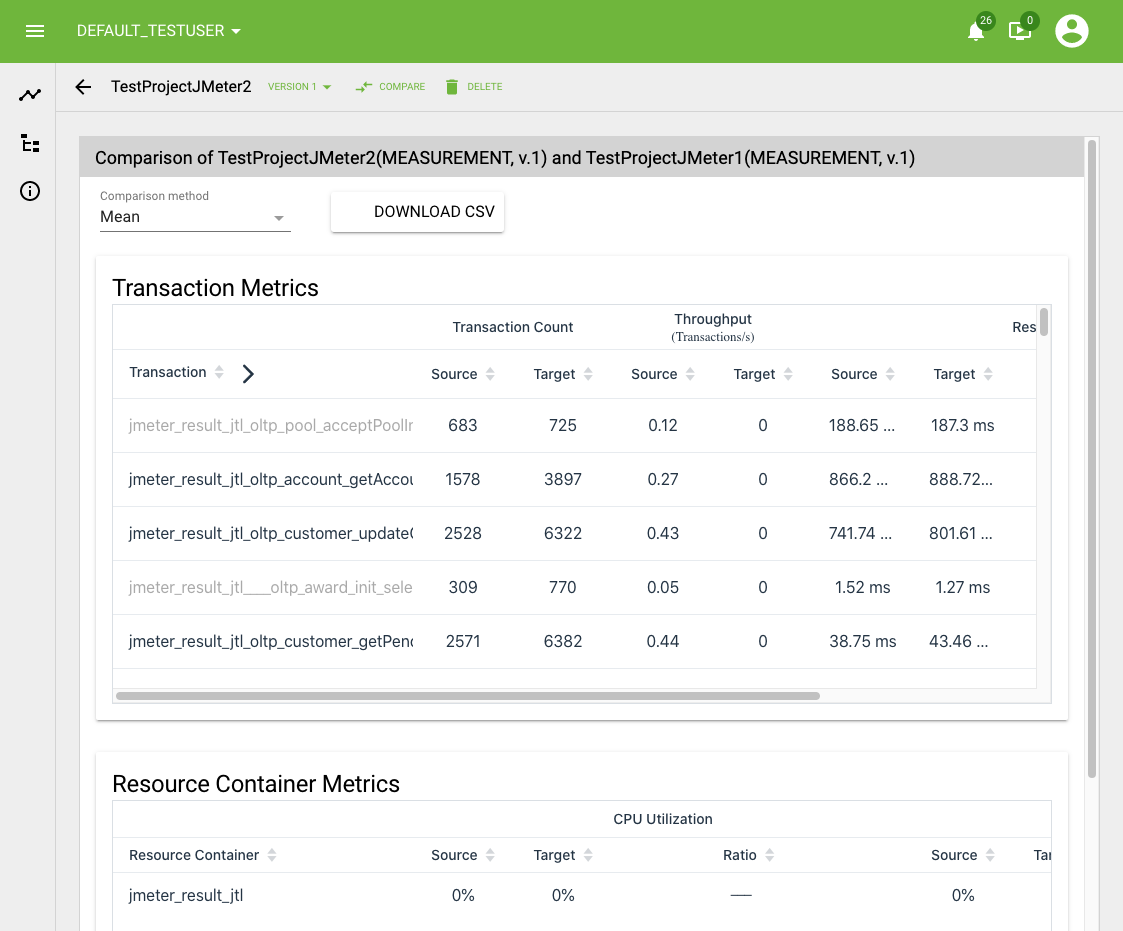
You can change comparison method by clicking on the corresponding menu under the comparison name. Here you can choose between Mean, Median, as well as 25%, 75% and 90% Percentile.
You can also sort data by columns and expand them by clicking on the arrow in front of the respective column name.

Data Sources
In the following section you can find documentation and instructions on how to perform analysis for each of the supported Data Sources.
Click on the link below to see the corresponding documentation.
Granting datascope access
When working in a team you might want to share the access to the same data and projects among multiple users. The following guide demonstrates how that can be done in the RETIT UI.
