OpenTelemetry
Contents:
About
OpenTelemetry is a set of tools and APIs that can be used to instrument, generate, collect, and export telemetry data (metrics, logs, and traces) into the RETIT Performance Analytics Suite. OpenTelemetry offers a wide variety of instrumentations for many different languages. Then performance data should be sent to a general OpenTelemetry Collector, that can be configured to forward this data directly to your RETIT account for analysis.
IMPORTANT:Make sure you choose a contribution (contrib) OpenTelemetry Collector release, as the authenticator extension used here is only available in those.
Configuring the OpenTelemetry Collector
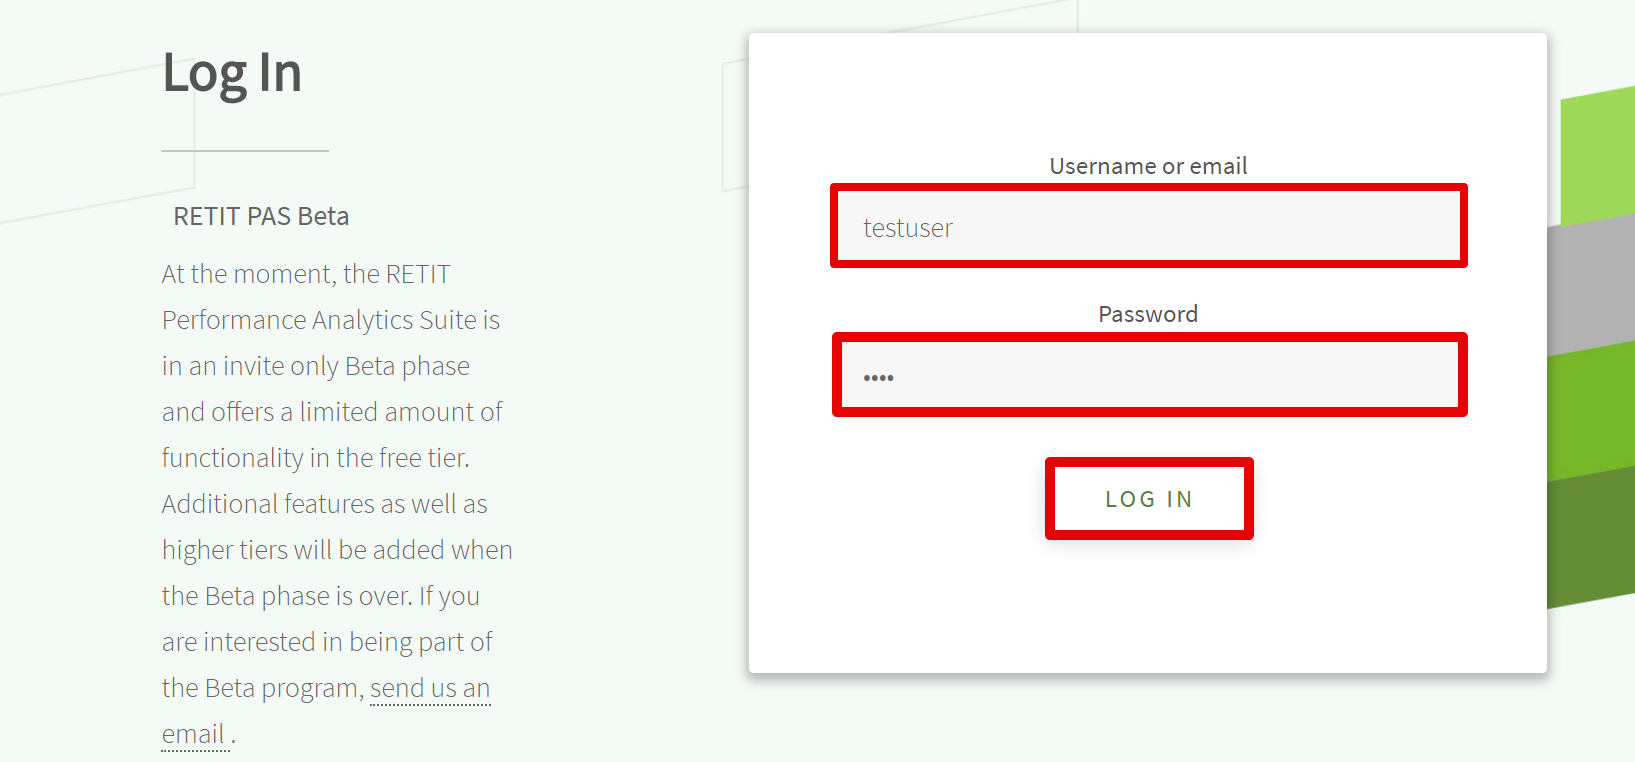
First, make sure your application is being monitored and data is being collected using a basic OpenTelemetry instrumentation as described in their documentation. Next, you can configure the OpenTelemetry Collector to forward this data. To do so you must first log on the RETIT Performance Analytics Suite. We recommend creating a new technical account for enterprise-wide use for this, rather than using your main account that is associated with your payment information. This technical account can be granted access to the data scope of your main as described in the secion datascope-access.html.

Here you can see the datascope for this account, which is shown in the top left corner. The current datascope is displayed when hovering over the info button and can be easily copied, this will be needed later on.

Then it's time to adjust the OpenTelemetry Collector configuration. Navigate to your OpenTelemetry Collector configuration file. Make sure that in addition to any other necessary properties,
the following properties for exporting are configured. First, we define an authenticator extension, that points to https://www.retit.io/tokenservice/token/opentelemetry. Make sure you
also set your ID and password.
extensions:
  oauth2client:
    client_id: yourIdHere
    client_secret: yourPasswordhere
    token_url: https://www.retit.io/tokenservice/token/opentelemetry
Next, define the exporter that will send the data to https://www.retit.io/tokenservice/token/opentelemetry. In the header section, you must also specify your datascope from earlier.
exporters:
  otlphttp:
    compression: none
    endpoint: https://www.retit.io/service/opentelemetry
    headers:
	  "Datascope-Id": "yourDatascopeHere"
    auth:
      authenticator: oauth2client
Finally, define the authenticator extension as a service to activate it. Also make sure your pipeline for traces references the exporter configured above.
service:
  extensions: [ oauth2client ]
  pipelines:
    traces:
      receivers: [ otlp ]
      processors: [ batch ]
      exporters: [ otlphttp ]
With that, the OpenTelemetry Collector is configured to send Telemetry data directly to your RETIT account and save it under your datascope.
Creating a Project
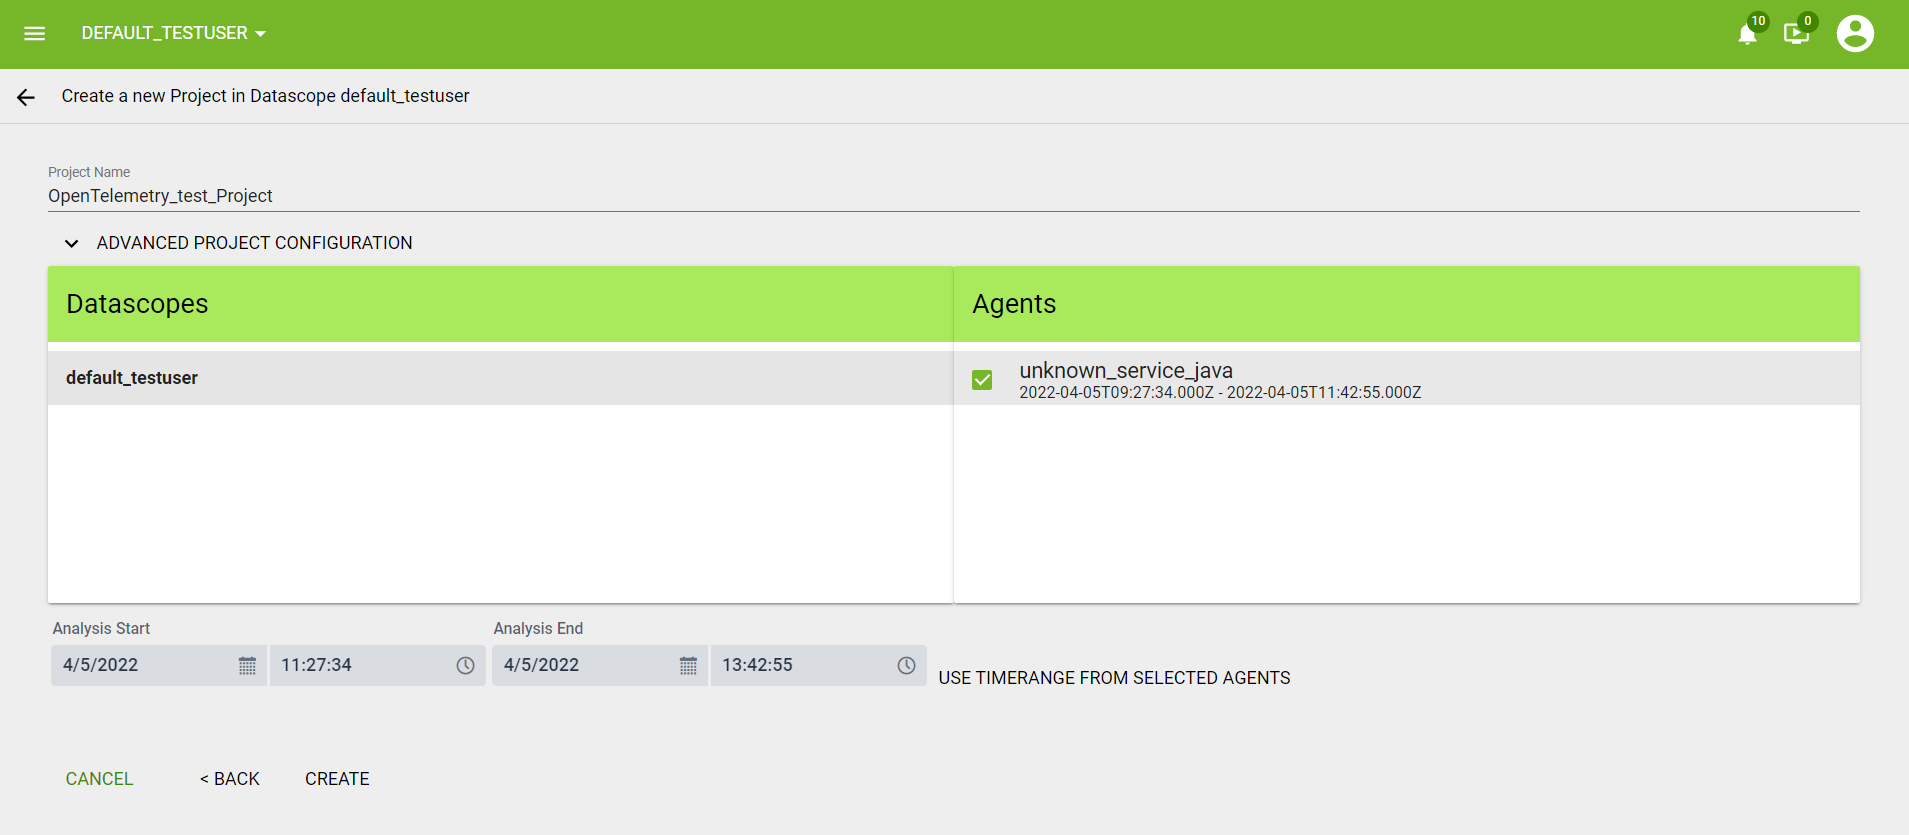
Now a project can be created with the Create a new project button. Each project belongs to a datascope and with it we will be able to access the data sent by the OpenTelemetry Collector.

Next, select the OpenTelemetry Datasource.

Here you should be able to see any agents and data exported by the OpenTelemetry Collector. Select the agents and timeframe you are interested in and create the project.

Afterwards, we will be taken to the previous page, where the pending project creation will be shown.

Once the project generation is complete, the project will be visible alongside the time range of the transactions in it.

Analysis and Comparison
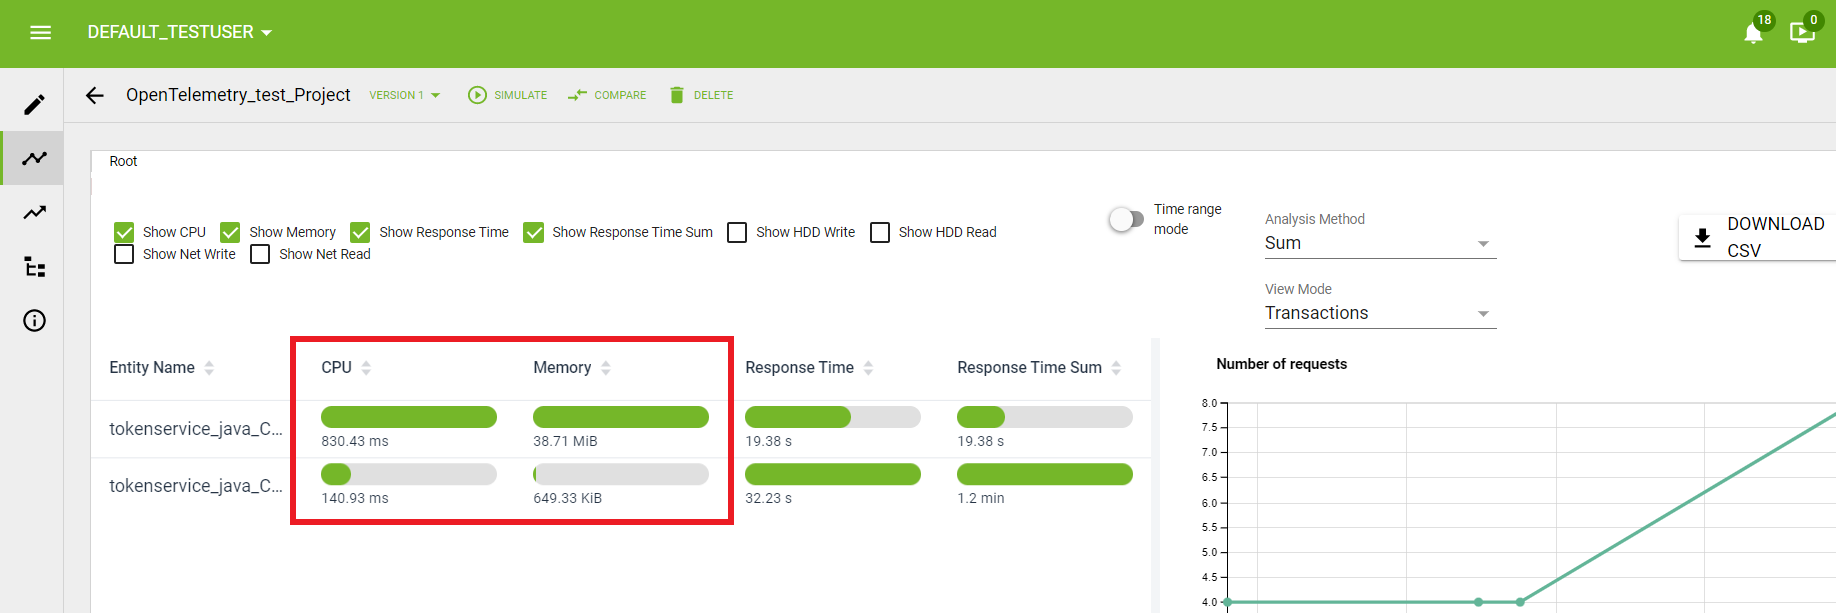
After clicking on the project card you will be taken to the analysis view of the project. Depending on the data that you upload, different types of information from the list above will be available for viewing.
Here you can also click on "Compare" button to retrieve a comparison of two projects.
For more information see Analysis and Comparison parts of the main documentation.
Capturing even more with the RETIT Java agent extension
Now that traces are being collected and sent to the RETIT Performance Analytics Suite, it is possible to extend the OpenTelemetry Java Instrumentation to capture additional information using the RETIT Java agent extension. This will allow you to capture CPU demand, storage usage, network traffic, among others, greatly empowering your analysis capabilities in the RETIT Performance Analytics Suite
First, you must download the RETIT extension to the OpenTemeletry Java agent. Make sure that you pick a version that is compatible with the version of the OpenTelemetry Java agent that you chose, currently we recommend the OpenTelemetry Java auto instrumentation version 1.14.0.
Next, you can run your application with the OpenTelemetry Java agent instrumentation like before, but now you may attach the RETIT extension to it. One way to attach an OpenTelemetry Java agent extension is to add the following argument when running the Java agent:
java -javaagent:path/to/opentelemetry-javaagent.jar \
     -Dotel.javaagent.extensions=path/to/retit-javaagent-extension-name.jar
     -jar myapp.jar
Before running the Java agent extension, you must configure the following environment variables:
OTEL_TRACES_EXPORTER=otlp
OTEL_TRACES_SAMPLER=parentbased_traceidratio
OTEL_TRACES_SAMPLER_ARG=1.0
OTEL_RESOURCE_ATTRIBUTES=service.name=NameOfYourApp
You can change the service name here and also the OTEL_TRACES_SAMPLER_ARG, which defines the proportion of traces that are exported (1.0 meaning 100%). You should define the environment variables that specify what additional values you want the Java agent to capture.
Note: CPU and heap demands as well as garbage collection events are collected by default if no other configuration is specified. Collection of disk demands is not supported on Windows hosts.
DE_RETIT_APM_LOG_CPU_DEMAND=true
DE_RETIT_APM_LOG_HEAP_DEMAND=true
DE_RETIT_APM_LOG_DISK_DEMAND=true
DE_RETIT_APM_LOG_GC_EVENT=true
Now, with the RETIT Java agent extension set up, traces with additional information can be sent to the RETIT Performance Analytics Suite. Import data and create a project as described in the previous section to see new and more interesting results. For example, if you activated memory and CPU demand logging, these properties should be visible in the analysis view.

References
OpenTelemetry documentation
OpenTelemetry Java agent extension documentation
